【K3S】13 - Rancher部署EFK
|字数总计:2.8k|阅读时长:15分钟|阅读量:|

前言
由于微服务日志分散在各个容器内,又不好做到统一时序查看,因此需要一个组件来观测日志,这里采用ELK,目前我们先创建单节点的elasticsearch和kibana。如果你想尝试使用二进制部署,可以看下这篇文章:【大数据】Elastic + canal + kibana 安装文档 | Leopold’s Blog (leofitz7.com)
ElasticSearch
这里的存储类我使用了rancher的local-path,自动帮我生成pv。节点默认在m2,请根据自身情况调整
elasticsearch.yaml
1
2
3
4
5
6
7
8
9
10
11
12
13
14
15
16
17
18
19
20
21
22
23
24
25
26
27
28
29
30
31
32
33
34
35
36
37
38
39
40
41
42
43
44
45
46
47
48
49
50
51
52
53
54
55
56
57
58
59
60
61
62
63
64
65
66
67
68
69
70
71
72
73
74
75
76
77
78
79
80
81
82
83
84
85
86
87
88
89
90
91
92
93
94
95
96
97
98
99
100
101
102
103
104
105
106
107
108
109
110
111
112
113
114
115
116
117
118
| apiVersion: v1
kind: Namespace
metadata:
name: es
---
apiVersion: v1
kind: PersistentVolumeClaim
metadata:
name: es-pvc
namespace: es
metadata:
annotations:
volume.beta.kubernetes.io/storage-provisioner: rancher.io/local-path
volume.kubernetes.io/selected-node: m2
volume.kubernetes.io/storage-provisioner: rancher.io/local-path
spec:
accessModes:
- ReadWriteOnce
resources:
requests:
storage: 5Gi
storageClassName: local-path
volumeMode: Filesystem
---
apiVersion: v1
kind: ConfigMap
metadata:
name: es
namespace: es
data:
elasticsearch.yml: |
cluster.name: my-cluster
node.name: node-1
node.max_local_storage_nodes: 3
network.host: 0.0.0.0
http.port: 9200
discovery.seed_hosts: ["127.0.0.1", "[::1]"]
cluster.initial_master_nodes: ["node-1"]
http.cors.enabled: true
http.cors.allow-origin: /.*/
---
apiVersion: apps/v1
kind: Deployment
metadata:
name: elasticsearch
namespace: es
spec:
selector:
matchLabels:
name: elasticsearch
replicas: 1
template:
metadata:
labels:
name: elasticsearch
spec:
initContainers:
- name: init-sysctl
image: busybox
command:
- sysctl
- -w
- vm.max_map_count=262144
securityContext:
privileged: true
containers:
- name: elasticsearch
image: elasticsearch:7.6.2
imagePullPolicy: IfNotPresent
resources:
limits:
cpu: 1000m
memory: 1.5Gi
requests:
cpu: 100m
memory: 512Mi
env:
- name: ES_JAVA_OPTS
value: -Xms512m -Xmx512m
ports:
- containerPort: 9200
volumeMounts:
- name: elasticsearch-data
mountPath: /usr/share/elasticsearch/data/
- name: es-config
mountPath: /usr/share/elasticsearch/config/elasticsearch.yml
subPath: elasticsearch.yml
nodeName: m2
volumes:
- name: elasticsearch-data
persistentVolumeClaim:
claimName: es-pvc
- name: es-config
configMap:
name: es
---
apiVersion: v1
kind: Service
metadata:
name: elasticsearch
namespace: es
labels:
name: elasticsearch
spec:
type: NodePort
ports:
- name: web-9200
port: 9200
targetPort: 9200
protocol: TCP
nodePort: 30505
selector:
name: elasticsearch
|
访问 ip:30505有如下回显则成功:
1
2
3
4
5
6
7
8
9
10
11
12
13
14
15
16
17
| {
"name" : "node-1",
"cluster_name" : "my-cluster",
"cluster_uuid" : "ycA1dlVDQNyNWdas7w8w",
"version" : {
"number" : "7.6.2",
"build_flavor" : "default",
"build_type" : "docker",
"build_hash" : "ef48eb35cf30adf4db14sds8aabd07ef6fb113f",
"build_date" : "2020-03-26T06:34:37.794943Z",
"build_snapshot" : false,
"lucene_version" : "8.4.0",
"minimum_wire_compatibility_version" : "6.8.0",
"minimum_index_compatibility_version" : "6.0.0-beta1"
},
"tagline" : "You Know, for Search"
}
|
Kibana
kibana-config.yaml:
1
2
3
4
5
| server.name: kibana
server.host: "0"
elasticsearch.hosts: [ "http://elasticsearch.es.svc.cluster.local:9200" ]
xpack.monitoring.ui.container.elasticsearch.enabled: true
i18n.locale: "zh-CN"
|
创建命名空间,写入config-map
1
2
| kubectl create ns logging
kubectl create cm kibana-cm --from-file=kibana-config.yaml -n logging
|
kibana.yaml:
1
2
3
4
5
6
7
8
9
10
11
12
13
14
15
16
17
18
19
20
21
22
23
24
25
26
27
28
29
30
31
32
33
34
35
36
37
38
39
40
41
42
43
44
45
46
47
48
49
50
51
52
53
54
55
56
57
58
59
60
61
| apiVersion: v1
kind: Service
metadata:
name: kibana
namespace: logging
labels:
app: kibana
spec:
type: NodePort
ports:
- name: web-5601
port: 5601
targetPort: 5601
protocol: TCP
nodePort: 30507
selector:
app: kibana
---
apiVersion: apps/v1
kind: Deployment
metadata:
name: kibana
namespace: logging
labels:
app: kibana
spec:
selector:
matchLabels:
app: kibana
template:
metadata:
labels:
app: kibana
spec:
nodeName: n1
containers:
- name: kibana
image: docker.elastic.co/kibana/kibana:7.6.2
resources:
limits:
cpu: 1000m
memory: 1Gi
requests:
cpu: 100m
memory: 512Mi
env:
- name: ELASTICSEARCH_HOSTS
value: http://elasticsearch.es.svc.cluster.local:9200
ports:
- containerPort: 5601
volumeMounts:
- name: kibana-config
mountPath: /usr/share/kibana/config/kibana.yml
subPath: kibana-config.yaml
volumes:
- name: kibana-config
configMap:
name: kibana-cm
items:
- key: "kibana-config.yaml"
path: "kibana-config.yaml"
|
访问 ip:30507即可
Fluentd
以往采集SpringBoot的日志,我是使用日志框架单独向es写入实现的,属于轻量情况下的单条写入,但在容器中,我们不仅有Java的项目,还有go等其他语言的项目,若每个项目都单独对接就复杂了。如果有一个框架能处理docker容器执行的日志,并对日志清洗处理,这样无论多少个容器我们都能查看时间流下的日志
当fluentd通过映射/var/log/containers,以tail命令实时查看docker生成的json日志时,我们再根据配置,筛选node有beta.kubernetes.io/fluentd-ds-ready=true 、 logging=true的pod的日志,并写入es
首先,我们给需要记录日志的node打上标签,让Fluentd配置的DaemonSet能够成功在对应节点生成监控pod
1
2
3
4
5
| kubectl label nodes m1 beta.kubernetes.io/fluentd-ds-ready=true
kubectl label nodes m2 beta.kubernetes.io/fluentd-ds-ready=true
kubectl label nodes m3 beta.kubernetes.io/fluentd-ds-ready=true
kubectl label nodes n1 beta.kubernetes.io/fluentd-ds-ready=true
kubectl label nodes n3 beta.kubernetes.io/fluentd-ds-ready=true
|
编写配置文件 fluentd-configmap.yaml
1
2
3
4
5
6
7
8
9
10
11
12
13
14
15
16
17
18
19
20
21
22
23
24
25
26
27
28
29
30
31
32
33
34
35
36
37
38
39
40
41
42
43
44
45
46
47
48
49
50
51
52
53
54
55
56
57
58
59
60
61
62
63
64
65
66
67
68
69
70
71
72
73
74
75
76
77
78
79
80
81
82
83
84
85
86
87
88
89
90
91
92
93
94
95
96
97
98
99
100
101
102
103
104
105
106
107
108
109
110
111
112
113
114
115
116
117
118
119
120
121
122
123
124
125
126
| kind: ConfigMap
apiVersion: v1
metadata:
name: fluentd-config
namespace: logging
data:
system.conf: |-
<system>
root_dir /tmp/fluentd-buffers/
</system>
containers.input.conf: |-
<source>
@id fluentd-containers.log
@type tail # Fluentd 内置的输入方式,其原理是不停地从源文件中获取新的日志。
path /var/log/containers/*.log # 挂载的服务器Docker容器日志地址
pos_file /var/log/es-containers.log.pos
tag raw.kubernetes.* # 设置日志标签
read_from_head true
<parse> # 多行格式化成JSON
@type multi_format # 使用 multi-format-parser 解析器插件
<pattern>
format json # JSON解析器
time_key time # 指定事件时间的时间字段
time_format %Y-%m-%dT%H:%M:%S.%NZ # 时间格式
</pattern>
<pattern>
format /^(?<time>.+) (?<stream>stdout|stderr) [^ ]* (?<log>.*)$/
time_format %Y-%m-%dT%H:%M:%S.%N%:z
</pattern>
</parse>
</source>
# 在日志输出中检测异常,并将其作为一条日志转发
# https://github.com/GoogleCloudPlatform/fluent-plugin-detect-exceptions
<match raw.kubernetes.**> # 匹配tag为raw.kubernetes.**日志信息
@id raw.kubernetes
@type detect_exceptions # 使用detect-exceptions插件处理异常栈信息
remove_tag_prefix raw # 移除 raw 前缀
message log
stream stream
multiline_flush_interval 5
max_bytes 500000
max_lines 1000
</match>
<filter **>
@id filter_concat
@type concat
key message
multiline_end_regexp /\n$/
separator ""
</filter>
<filter kubernetes.**>
@type kubernetes_metadata
@id filter_kube_metadata
</filter>
<filter kubernetes.**>
@id filter_parser
@type parser
key_name log
reserve_data true
remove_key_name_field true
<parse>
@type multi_format
<pattern>
format json
</pattern>
<pattern>
format none
</pattern>
</parse>
</filter>
<filter kubernetes.**>
@type record_transformer
remove_keys $.docker.container_id,$.kubernetes.container_image_id,$.kubernetes.pod_id,$.kubernetes.namespace_id,$.kubernetes.master_url,$.kubernetes.labels.pod-template-hash
</filter>
<filter kubernetes.**>
@id filter_log
@type grep
<regexp>
key $.kubernetes.labels.logging
pattern ^true$
</regexp>
</filter>
forward.input.conf: |-
# 监听通过TCP发送的消息
<source>
@id forward
@type forward
</source>
output.conf: |-
<match **>
@id elasticsearch
@type elasticsearch
@log_level info
include_tag_key true
host elasticsearch.es.svc.cluster.local
port 9200
logstash_format true
logstash_prefix k8s # 设置 index 前缀为 k8s
request_timeout 30s
<buffer>
@type file
path /var/log/fluentd-buffers/kubernetes.system.buffer
flush_mode interval
retry_type exponential_backoff
flush_thread_count 2
flush_interval 5s
retry_forever
retry_max_interval 30
chunk_limit_size 2M
queue_limit_length 8
overflow_action block
</buffer>
</match>
|
创建 fluentd-daemonset.yaml
1
2
3
4
5
6
7
8
9
10
11
12
13
14
15
16
17
18
19
20
21
22
23
24
25
26
27
28
29
30
31
32
33
34
35
36
37
38
39
40
41
42
43
44
45
46
47
48
49
50
51
52
53
54
55
56
57
58
59
60
61
62
63
64
65
66
67
68
69
70
71
72
73
74
75
76
77
78
79
80
81
82
83
84
85
86
87
88
89
90
91
92
93
94
95
96
97
98
99
100
101
102
103
104
105
| apiVersion: v1
kind: ServiceAccount
metadata:
name: fluentd-es
namespace: logging
labels:
k8s-app: fluentd-es
kubernetes.io/cluster-service: "true"
addonmanager.kubernetes.io/mode: Reconcile
---
kind: ClusterRole
apiVersion: rbac.authorization.k8s.io/v1
metadata:
name: fluentd-es
labels:
k8s-app: fluentd-es
kubernetes.io/cluster-service: "true"
addonmanager.kubernetes.io/mode: Reconcile
rules:
- apiGroups:
- ""
resources:
- "namespaces"
- "pods"
verbs:
- "get"
- "watch"
- "list"
---
kind: ClusterRoleBinding
apiVersion: rbac.authorization.k8s.io/v1
metadata:
name: fluentd-es
labels:
k8s-app: fluentd-es
kubernetes.io/cluster-service: "true"
addonmanager.kubernetes.io/mode: Reconcile
subjects:
- kind: ServiceAccount
name: fluentd-es
namespace: logging
apiGroup: ""
roleRef:
kind: ClusterRole
name: fluentd-es
apiGroup: ""
---
apiVersion: apps/v1
kind: DaemonSet
metadata:
name: fluentd-es
namespace: logging
labels:
k8s-app: fluentd-es
kubernetes.io/cluster-service: "true"
addonmanager.kubernetes.io/mode: Reconcile
spec:
selector:
matchLabels:
k8s-app: fluentd-es
template:
metadata:
labels:
k8s-app: fluentd-es
kubernetes.io/cluster-service: "true"
annotations:
scheduler.alpha.kubernetes.io/critical-pod: ''
spec:
serviceAccountName: fluentd-es
containers:
- name: fluentd-es
image: quay.io/fluentd_elasticsearch/fluentd:v3.0.1
env:
- name: FLUENTD_ARGS
value: --no-supervisor -q
resources:
limits:
memory: 200Mi
requests:
cpu: 100m
memory: 200Mi
volumeMounts:
- name: varlog
mountPath: /var/log
- name: varlibdockercontainers
mountPath: /var/lib/docker/containers
readOnly: true
- name: config-volume
mountPath: /etc/fluent/config.d
nodeSelector:
beta.kubernetes.io/fluentd-ds-ready: "true"
tolerations:
- operator: Exists
terminationGracePeriodSeconds: 30
volumes:
- name: varlog
hostPath:
path: /var/log
- name: varlibdockercontainers
hostPath:
path: /var/lib/docker/containers
- name: config-volume
configMap:
name: fluentd-config
|
运行以上两个配置
1
2
| kubectl apply -f fluentd-configmap.yaml
kubectl apply -f fluentd-daemonset.yaml
|
为你的pod打上 logging=true 标签
1
| kubectl label pods test-pods logging=true -n test-namespase
|
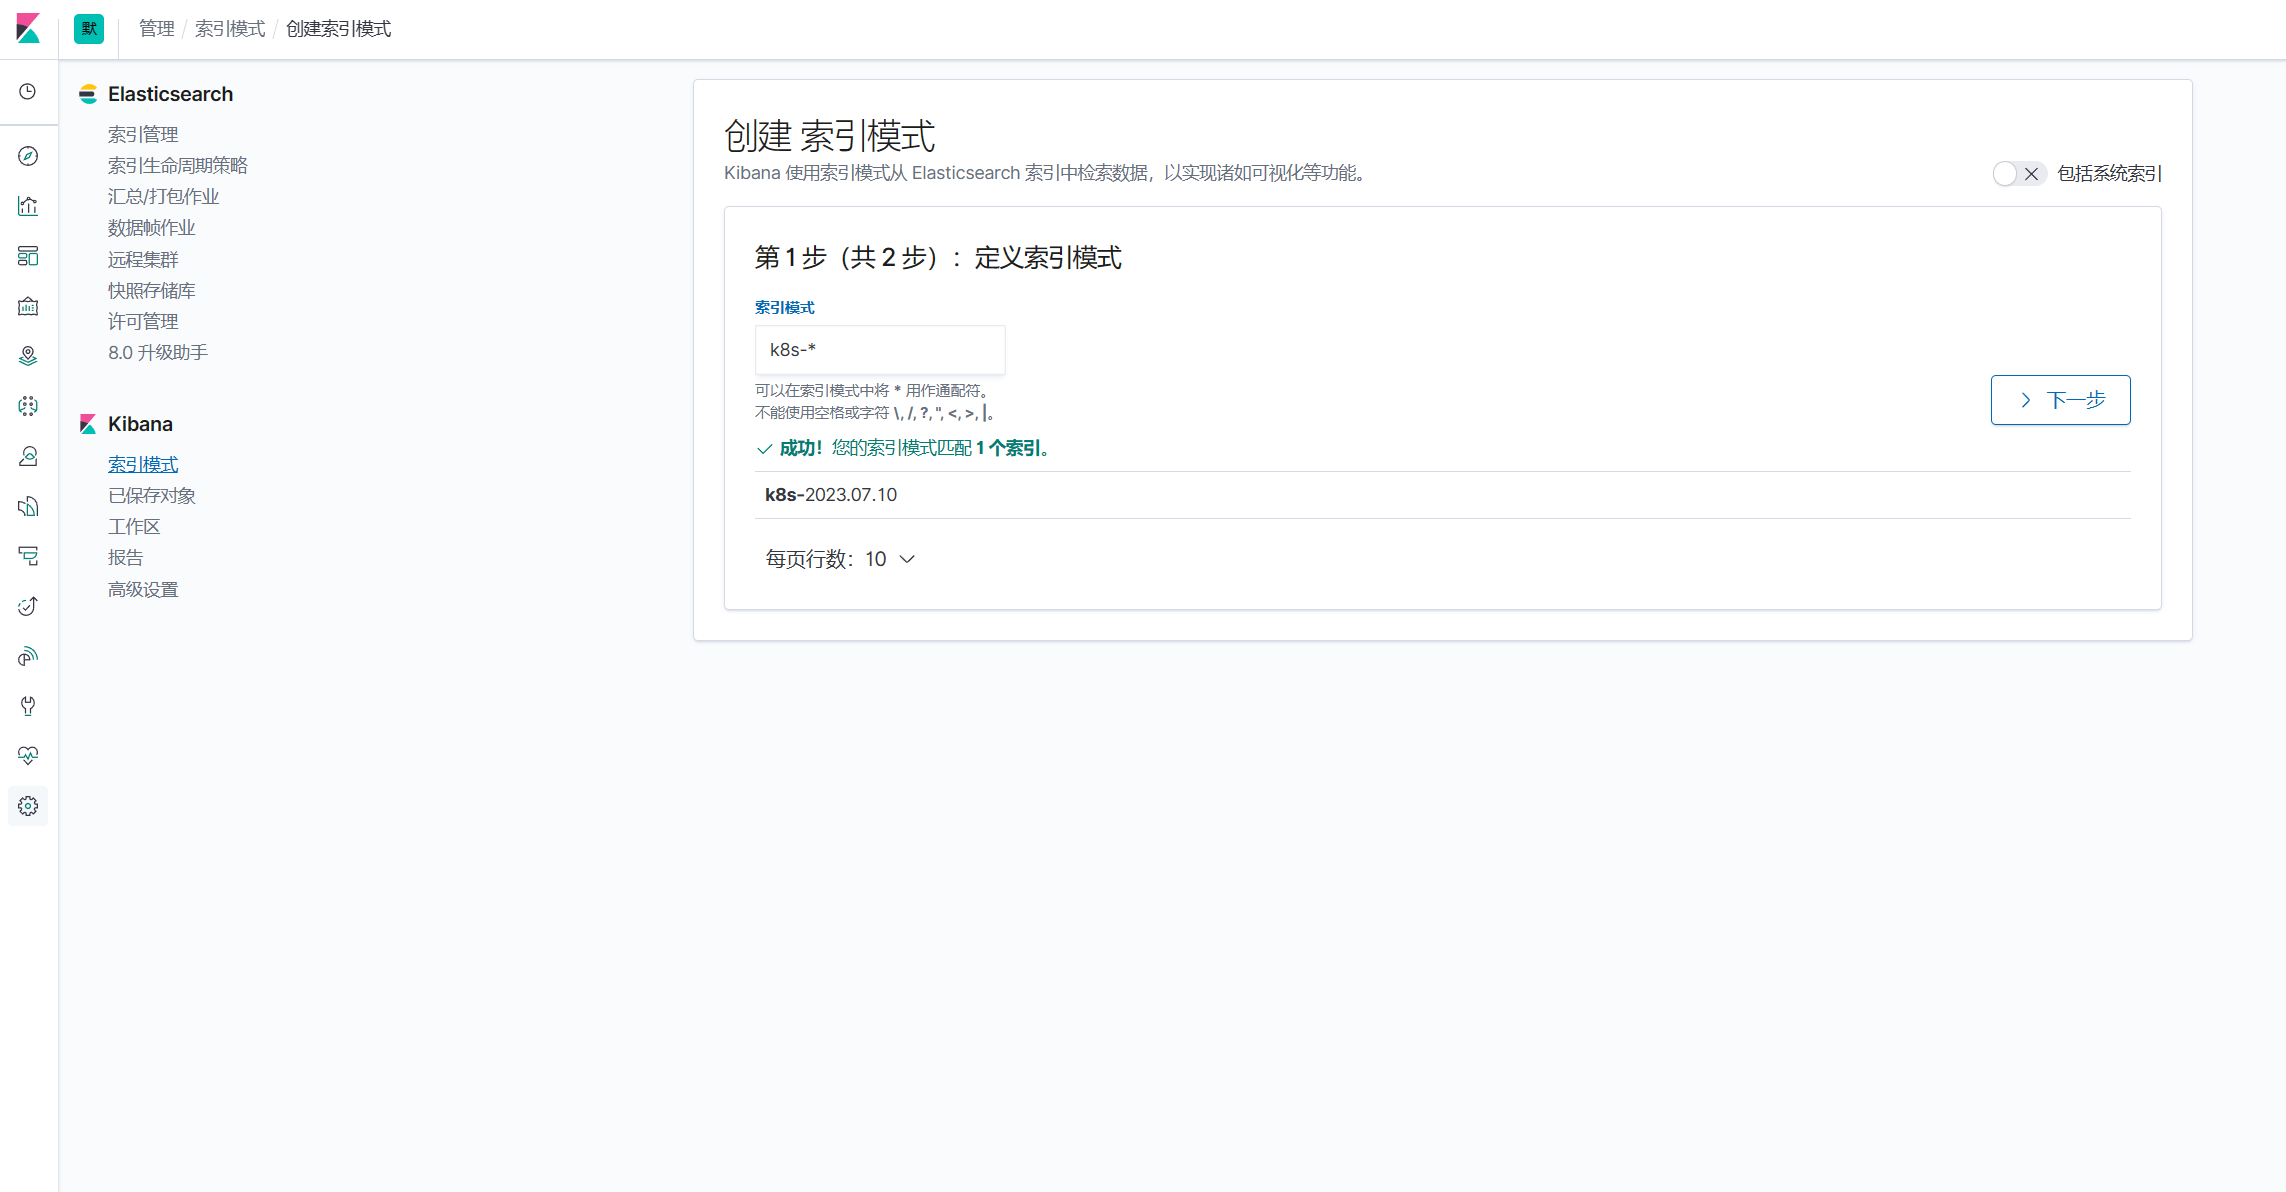
如果此pod产生了日志,那么我们会在kibana上看到以k8s开头的索引
其他
备份一下SpringBoot配置的方法:
1
2
3
4
5
6
7
8
9
10
11
12
13
14
15
16
17
18
19
20
21
22
23
24
25
26
27
28
29
30
31
32
33
34
35
36
37
38
39
40
41
42
43
44
45
46
47
48
49
50
51
52
53
54
55
56
57
58
59
60
61
62
63
64
65
66
67
68
69
70
71
72
73
74
75
76
77
78
79
80
81
82
83
84
85
86
87
88
89
90
91
92
93
94
95
96
97
98
99
100
101
102
103
104
105
106
| <?xml version="1.0" encoding="UTF-8" ?>
<configuration>
<include resource="org/springframework/boot/logging/logback/defaults.xml"/>
<include resource="org/springframework/boot/logging/logback/console-appender.xml"/>
<springProperty scope="context" name="active" source="spring.profiles.active" defaultValue="dev"/>
<appender name="STDOUT" class="ch.qos.logback.core.ConsoleAppender">
<encoder class="ch.qos.logback.classic.encoder.PatternLayoutEncoder">
<pattern>%d{yyyy-MM-dd HH:mm:ss.SSS} [%thread] %highlight(%-5level) %cyan(%logger{50}:%L) - %msg%n</pattern>
</encoder>
</appender>
<appender name="FILE" class="ch.qos.logback.core.rolling.RollingFileAppender">
<file>${LOG_PATH}/main.log</file>
<encoder class="ch.qos.logback.classic.encoder.PatternLayoutEncoder">
<pattern>%d{yyyy-MM-dd HH:mm:ss.SSS} [%thread] %-5level %logger{50}:%L - %msg%n</pattern>
</encoder>
<rollingPolicy class="ch.qos.logback.core.rolling.SizeAndTimeBasedRollingPolicy">
<fileNamePattern>${LOG_PATH}/wxatrep_%d{dd-MM-yyyy}_%i.log</fileNamePattern>
<maxFileSize>10MB</maxFileSize>
<maxHistory>30</maxHistory>
<totalSizeCap>500MB</totalSizeCap>
</rollingPolicy>
</appender>
<appender name="ELASTIC" class="com.internetitem.logback.elasticsearch.ElasticsearchAppender">
<url>http://elasticsearch.es.svc.cluster.local:9200/_bulk</url>
<index>xxx-${active}</index>
<type>${active}</type>
<connectTimeout>30000</connectTimeout>
<errorsToStderr>false</errorsToStderr>
<includeCallerData>false</includeCallerData>
<logsToStderr>false</logsToStderr>
<maxQueueSize>104857600</maxQueueSize>
<maxRetries>3</maxRetries>
<readTimeout>30000</readTimeout>
<sleepTime>250</sleepTime>
<rawJsonMessage>false</rawJsonMessage>
<includeMdc>false</includeMdc>
<maxMessageSize>-1</maxMessageSize>
<authentication class="com.internetitem.logback.elasticsearch.config.BasicAuthentication"/>
<properties>
<property>
<name>host</name>
<value>${HOSTNAME}</value>
<allowEmpty>false</allowEmpty>
</property>
<property>
<name>level</name>
<value>%level</value>
</property>
<property>
<name>thread</name>
<value>%thread</value>
</property>
<property>
<name>stacktrace</name>
<value>%ex</value>
</property>
<property>
<name>logger</name>
<value>%logger</value>
</property>
<property>
<name>env</name>
<value>${active}</value>
</property>
</properties>
<headers>
<header>
<name>Content-Type</name>
<value>application/json</value>
</header>
</headers>
<filter class="ch.qos.logback.classic.filter.LevelFilter">
<level>error</level>
<onMatch>ACCEPT</onMatch>
<onMismatch>DENY</onMismatch>
</filter>
</appender>
<springProfile name="dev">
<root level="INFO">
<appender-ref ref="STDOUT"/>
</root>
</springProfile>
<springProfile name="test">
<root level="INFO">
<appender-ref ref="FILE"/>
<appender-ref ref="ELASTIC"/>
</root>
</springProfile>
<springProfile name="prod">
<root level="INFO">
<appender-ref ref="FILE"/>
<appender-ref ref="ELASTIC"/>
</root>
</springProfile>
</configuration>
|
参考资料
[1] [在 Kubernetes 上搭建 EFK 日志收集系统更新]-阳明的博客|Kubernetes|Istio|Prometheus|Python|Golang|云原生 (qikqiak.com)