前言 本文主要讲述 2023 K3s Rancher 部署 Prometheus + Grafana
如果你还没有部署 K3s 和 Rancher ,你可以浏览这篇文章:【K3S】01 - 异地集群初始化
环境声明
hostname
系统
配置
节点
角色
部署
m1
Ubuntu-Server(20.04)
2c4g
192.168.0.67/32
control-plane,etcd,master
k3s(v1.24.6+k3n1) server
n1
Ubuntu-Server(20.04)
1c2g
192.168.0.102/32
control-plane,etcd,master
k3s(v1.24.6+k3n1) server
m2
Ubuntu-Server(20.04)
2c4g
172.25.4.244/32
control-plane,etcd,master
k3s(v1.24.6+k3n1) server
harbor
Ubuntu-Server(20.04)
2c4g
192.168.0.88
Docker-Hub
Harbor(2.7.1)
节点均用 WireGuard 打通内网,后续所有节点路由均用内网ip访问
方法一:YAML安装 由于我的机器内存比较小,所以这里我选择手动部署安装对应组件,整体不超过1G,本小节内容均采用最新(202307)对应版本
命名空间 首先创建监控命名空间:
1 kubectl create ns guardian
Prometheus 创建Prometheus配置文件 prometheus-cfg.yaml:
1
2
3
4
5
6
7
8
9
10
11
12
13
14
15
16
17
18
19
20
21
22
23
24
25
26
27
28
29
30
31
32
33
34
35
36
37
38
39
40
41
42
43
44
45
46
47
48
49
50
51
52
53
54
55
56
57
58
59
60
61
62
63
64
65
66
67
68
--- kind: ConfigMap apiVersion: v1 metadata: labels: app: prometheus name: prometheus-config namespace: guardian data: prometheus.yml: | global: scrape_interval: 15s scrape_timeout: 10s evaluation_interval: 1m scrape_configs: - job_name: 'kubernetes-kubelet' scheme: https tls_config: ca_file: /var/run/secrets/kubernetes.io/serviceaccount/ca.crt insecure_skip_verify: true bearer_token_file: /var/run/secrets/kubernetes.io/serviceaccount/token kubernetes_sd_configs: - role: node relabel_configs: - action: labelmap regex: __meta_kubernetes_node_label_(.+) - target_label: __address__ replacement: kubernetes.default.svc.cluster.local:443 - source_labels: [__meta_kubernetes_node_name] regex: (.+) target_label: __metrics_path__ replacement: /api/v1/nodes/${1}/proxy/metrics - job_name: 'kubernetes-cadvisor' scheme: https tls_config: ca_file: /var/run/secrets/kubernetes.io/serviceaccount/ca.crt insecure_skip_verify: true bearer_token_file: /var/run/secrets/kubernetes.io/serviceaccount/token kubernetes_sd_configs: - role: node relabel_configs: - action: labelmap regex: __meta_kubernetes_node_label_(.+) - target_label: __address__ replacement: kubernetes.default.svc.cluster.local:443 - source_labels: [__meta_kubernetes_node_name] regex: (.+) target_label: __metrics_path__ replacement: /api/v1/nodes/${1}/proxy/metrics/cadvisor - job_name: 'kubernetes-kube-state' kubernetes_sd_configs: - role: pod relabel_configs: - action: labelmap regex: __meta_kubernetes_pod_label_(.+) - source_labels: [__meta_kubernetes_namespace] action: replace target_label: kubernetes_namespace - source_labels: [__meta_kubernetes_pod_name] action: replace target_label: kubernetes_pod_name - source_labels: [__meta_kubernetes_pod_label_grafanak8sapp] regex: .*true.* action: keep - source_labels: ['__meta_kubernetes_pod_label_daemon', '__meta_kubernetes_pod_node_name'] regex: 'node-exporter;(.*)' action: replace target_label: nodename
权限prometheus-rabc.yaml:
1
2
3
4
5
6
7
8
9
10
11
12
13
14
15
16
17
18
19
20
21
22
23
24
25
26
27
28
29
30
31
32
33
34
35
36
37
38
39
apiVersion: rbac.authorization.k8s.io/v1 kind: ClusterRole metadata: name: prometheus rules: - apiGroups: ["" ] resources: - nodes - nodes/proxy - services - endpoints - pods verbs: ["get" , "list" , "watch" ] - apiGroups: - networking.k8s.io resources: - ingresses verbs: ["get" , "list" , "watch" ] - nonResourceURLs: ["/metrics" ] verbs: ["get" ] --- apiVersion: v1 kind: ServiceAccount metadata: name: prometheus namespace: guardian --- apiVersion: rbac.authorization.k8s.io/v1 kind: ClusterRoleBinding metadata: name: prometheus roleRef: apiGroup: rbac.authorization.k8s.io kind: ClusterRole name: prometheus subjects: - kind: ServiceAccount name: prometheus namespace: guardian
Deployment prometheus-deploy.yaml :
这里我们需要创建一个pvc,用于存储Prometheus收集的指标,这里我使用了rancher的local-storage,能帮助我们自动创建pv,你可以改为你自己的存储卷
1
2
3
4
5
6
7
8
9
10
11
12
13
14
15
16
17
18
19
20
21
22
23
24
25
26
27
28
29
30
31
32
33
34
35
36
37
38
39
40
41
42
43
44
45
46
47
48
49
50
51
52
53
54
55
56
57
58
59
60
61
apiVersion: v1 kind: PersistentVolumeClaim metadata: name: prometheus-server-data-pvc namespace: guardian metadata: annotations: volume.beta.kubernetes.io/storage-provisioner: rancher.io/local-path volume.kubernetes.io/selected-node: n1 volume.kubernetes.io/storage-provisioner: rancher.io/local-path spec: accessModes: - ReadWriteOnce resources: requests: storage: 5Gi storageClassName: local-path volumeMode: Filesystem --- apiVersion: apps/v1 kind: Deployment metadata: labels: app: prometheus name: prometheus namespace: guardian spec: replicas: 1 selector: matchLabels: app: prometheus-server template: metadata: labels: app: prometheus-server spec: serviceAccountName: prometheus containers: - name: prometheus image: prom/prometheus:v2.46.0 imagePullPolicy: Always ports: - name: web containerPort: 9090 protocol: TCP args: - "--config.file=/etc/prometheus/prometheus.yml" - "--storage.tsdb.path=/prometheus" - "--storage.tsdb.retention.time=7d" volumeMounts: - name: config-prometheus mountPath: /etc/prometheus - name: prometheus-server-data mountPath: /prometheus volumes: - name: config-prometheus configMap: name: prometheus-config - name: prometheus-server-data persistentVolumeClaim: claimName: prometheus-server-data-pvc
service prometheus-svc.yaml :
1
2
3
4
5
6
7
8
9
10
11
12
13
14
15
16
17
18
19
20
21
22
23
24
25
26
27
28
29
--- apiVersion: v1 kind: Service metadata: name: svc-prometheus-cluster namespace: guardian spec: type: ClusterIP ports: - port: 9090 targetPort: 9090 selector: app: prometheus-server --- apiVersion: v1 kind: Service metadata: name: svc-prometheus-np namespace: guardian spec: type: NodePort ports: - name: web port: 9090 targetPort: 9090 nodePort: 31480 selector: app: prometheus-server
执行以上文件:
1
2
3
4
kubectl apply -f prometheus-cfg.yaml kubectl apply -f prometheus-deploy.yaml kubectl apply -f prometheus-rabc.yaml kubectl apply -f prometheus-svc.yaml
部署成功后访问任意节点:31480即可访问主页
Node Exporter 由于我们需要在每台机器上部署采集的Node Exporter,所以我们需要创建一个Daemon Set类型的应用
node-exporter-ds.yaml:
1
2
3
4
5
6
7
8
9
10
11
12
13
14
15
16
17
18
19
20
21
22
23
24
25
26
27
28
29
30
31
32
33
34
35
36
37
38
39
40
41
42
43
apiVersion: apps/v1 kind: DaemonSet metadata: name: node-exporter namespace: guardian spec: selector: matchLabels: daemon: node-exporter grafanak8sapp: "true" template: metadata: name: node-exporter labels: daemon: node-exporter grafanak8sapp: "true" spec: containers: - name: node-exporter image: quay.io/prometheus/node-exporter:v1.6.1 args: - --path.procfs=/host/proc - --path.sysfs=/host/sys ports: - name: node-exporter containerPort: 9100 volumeMounts: - name: sys readOnly: true mountPath: /host/sys - name: proc readOnly: true mountPath: /host/proc imagePullPolicy: IfNotPresent hostNetwork: true hostPID: true volumes: - name: proc hostPath: path: /proc - name: sys hostPath: path: /sys
kube-state-metrics 我们通过 kube-state-metrics 来监控k3s
kube-state-metrics-deploy.yaml:
1
2
3
4
5
6
7
8
9
10
11
12
13
14
15
16
17
18
19
20
21
22
23
24
25
26
27
28
29
30
31
apiVersion: apps/v1 kind: Deployment metadata: name: kube-state-metrics namespace: guardian spec: selector: matchLabels: k8s-app: kube-state-metrics grafanak8sapp: "true" replicas: 1 template: metadata: labels: k8s-app: kube-state-metrics grafanak8sapp: "true" spec: serviceAccountName: kube-state-metrics containers: - name: kube-state-metrics image: bitnami/kube-state-metrics:2.9.2 ports: - name: http-metrics containerPort: 8080 protocol: TCP readinessProbe: httpGet: path: /healthz port: http-metrics initialDelaySeconds: 5 timeoutSeconds: 5
kube-state-metrics-rabc.yaml:
1
2
3
4
5
6
7
8
9
10
11
12
13
14
15
16
17
18
19
20
21
22
23
24
25
26
27
28
29
30
31
32
33
34
35
36
37
38
39
40
41
42
43
44
45
46
47
48
49
50
51
52
53
54
55
56
57
58
59
60
61
62
63
64
65
66
67
68
69
70
71
72
73
74
75
76
77
78
79
80
81
82
83
84
85
86
87
88
89
90
91
92
93
94
95
96
97
98
99
100
101
102
103
104
105
106
107
108
109
110
111
112
113
114
115
116
117
118
119
120
121
122
123
124
125
126
127
128
129
130
131
132
133
134
135
136
137
138
139
140
141
142
143
144
145
146
147
148
149
150
151
152
153
154
155
156
157
158
159
160
161
162
163
164
165
166
167
168
169
170
171
172
173
174
175
176
177
178
179
apiVersion: v1 kind: ServiceAccount metadata: name: kube-state-metrics namespace: guardian --- apiVersion: rbac.authorization.k8s.io/v1 kind: Role metadata: namespace: guardian name: kube-state-metrics rules: - apiGroups: ["" ] resources: - pods verbs: ["get" ] - apiGroups: ["extensions" ] resources: - deployments resourceNames: ["kube-state-metrics" ] verbs: ["get" , "update" ] --- apiVersion: rbac.authorization.k8s.io/v1 kind: RoleBinding metadata: name: kube-state-metrics namespace: guardian roleRef: apiGroup: rbac.authorization.k8s.io kind: Role name: kube-state-metrics subjects: - kind: ServiceAccount name: kube-state-metrics namespace: guardian --- apiVersion: rbac.authorization.k8s.io/v1 kind: ClusterRole metadata: labels: app.kubernetes.io/component: exporter app.kubernetes.io/name: kube-state-metrics app.kubernetes.io/version: 2.9 .2 name: kube-state-metrics rules: - apiGroups: - "" resources: - configmaps - secrets - nodes - pods - services - serviceaccounts - resourcequotas - replicationcontrollers - limitranges - persistentvolumeclaims - persistentvolumes - namespaces - endpoints verbs: - list - watch - apiGroups: - apps resources: - statefulsets - daemonsets - deployments - replicasets verbs: - list - watch - apiGroups: - batch resources: - cronjobs - jobs verbs: - list - watch - apiGroups: - autoscaling resources: - horizontalpodautoscalers verbs: - list - watch - apiGroups: - authentication.k8s.io resources: - tokenreviews verbs: - create - apiGroups: - authorization.k8s.io resources: - subjectaccessreviews verbs: - create - apiGroups: - policy resources: - poddisruptionbudgets verbs: - list - watch - apiGroups: - certificates.k8s.io resources: - certificatesigningrequests verbs: - list - watch - apiGroups: - discovery.k8s.io resources: - endpointslices verbs: - list - watch - apiGroups: - storage.k8s.io resources: - storageclasses - volumeattachments verbs: - list - watch - apiGroups: - admissionregistration.k8s.io resources: - mutatingwebhookconfigurations - validatingwebhookconfigurations verbs: - list - watch - apiGroups: - networking.k8s.io resources: - networkpolicies - ingresses - ingressclasses verbs: - list - watch - apiGroups: - coordination.k8s.io resources: - leases verbs: - list - watch - apiGroups: - rbac.authorization.k8s.io resources: - clusterrolebindings - clusterroles - rolebindings - roles verbs: - list - watch --- apiVersion: rbac.authorization.k8s.io/v1 kind: ClusterRoleBinding metadata: name: kube-state-metrics namespace: guardian roleRef: apiGroup: rbac.authorization.k8s.io kind: ClusterRole name: kube-state-metrics subjects: - kind: ServiceAccount name: kube-state-metrics namespace: guardian
创建完后访问 任意节点ip:31480/targets,你能在Prometheus里看到已成功接入
Grafana grafana-depoly.yaml:
1
2
3
4
5
6
7
8
9
10
11
12
13
14
15
16
17
18
19
20
21
22
23
24
25
26
27
28
29
30
31
32
33
34
apiVersion: apps/v1 kind: Deployment metadata: name: grafana-server namespace: guardian spec: replicas: 1 selector: matchLabels: app: grafana-server template: metadata: labels: app: grafana-server spec: containers: - name: grafana image: grafana/grafana:10.0.3 ports: - containerPort: 3000 protocol: TCP volumeMounts: - mountPath: /var/lib/grafana name: grafana-storage env: - name: GF_SERVER_HTTP_PORT value: "3000" - name: GF_SECURITY_ADMIN_PASSWORD value: "helloworld" - name: GF_INSTALL_PLUGINS value: "grafana-kubernetes-app" volumes: - name: grafana-storage emptyDir: {}
grafana-svc.yaml:
1
2
3
4
5
6
7
8
9
10
11
12
13
14
15
16
17
18
19
20
21
22
23
24
25
26
27
28
29
--- apiVersion: v1 kind: Service metadata: name: svc-grafana-cluster namespace: guardian spec: type: ClusterIP ports: - port: 3000 targetPort: 3000 selector: app: grafana-server --- apiVersion: v1 kind: Service metadata: name: svc-grafana-np namespace: guardian spec: type: NodePort ports: - name: web port: 3000 targetPort: 3000 nodePort: 31481 selector: app: grafana-server
创建完成后访问 任意节点:31481即可访问grafana主页,用户名admin,密码 helloworld
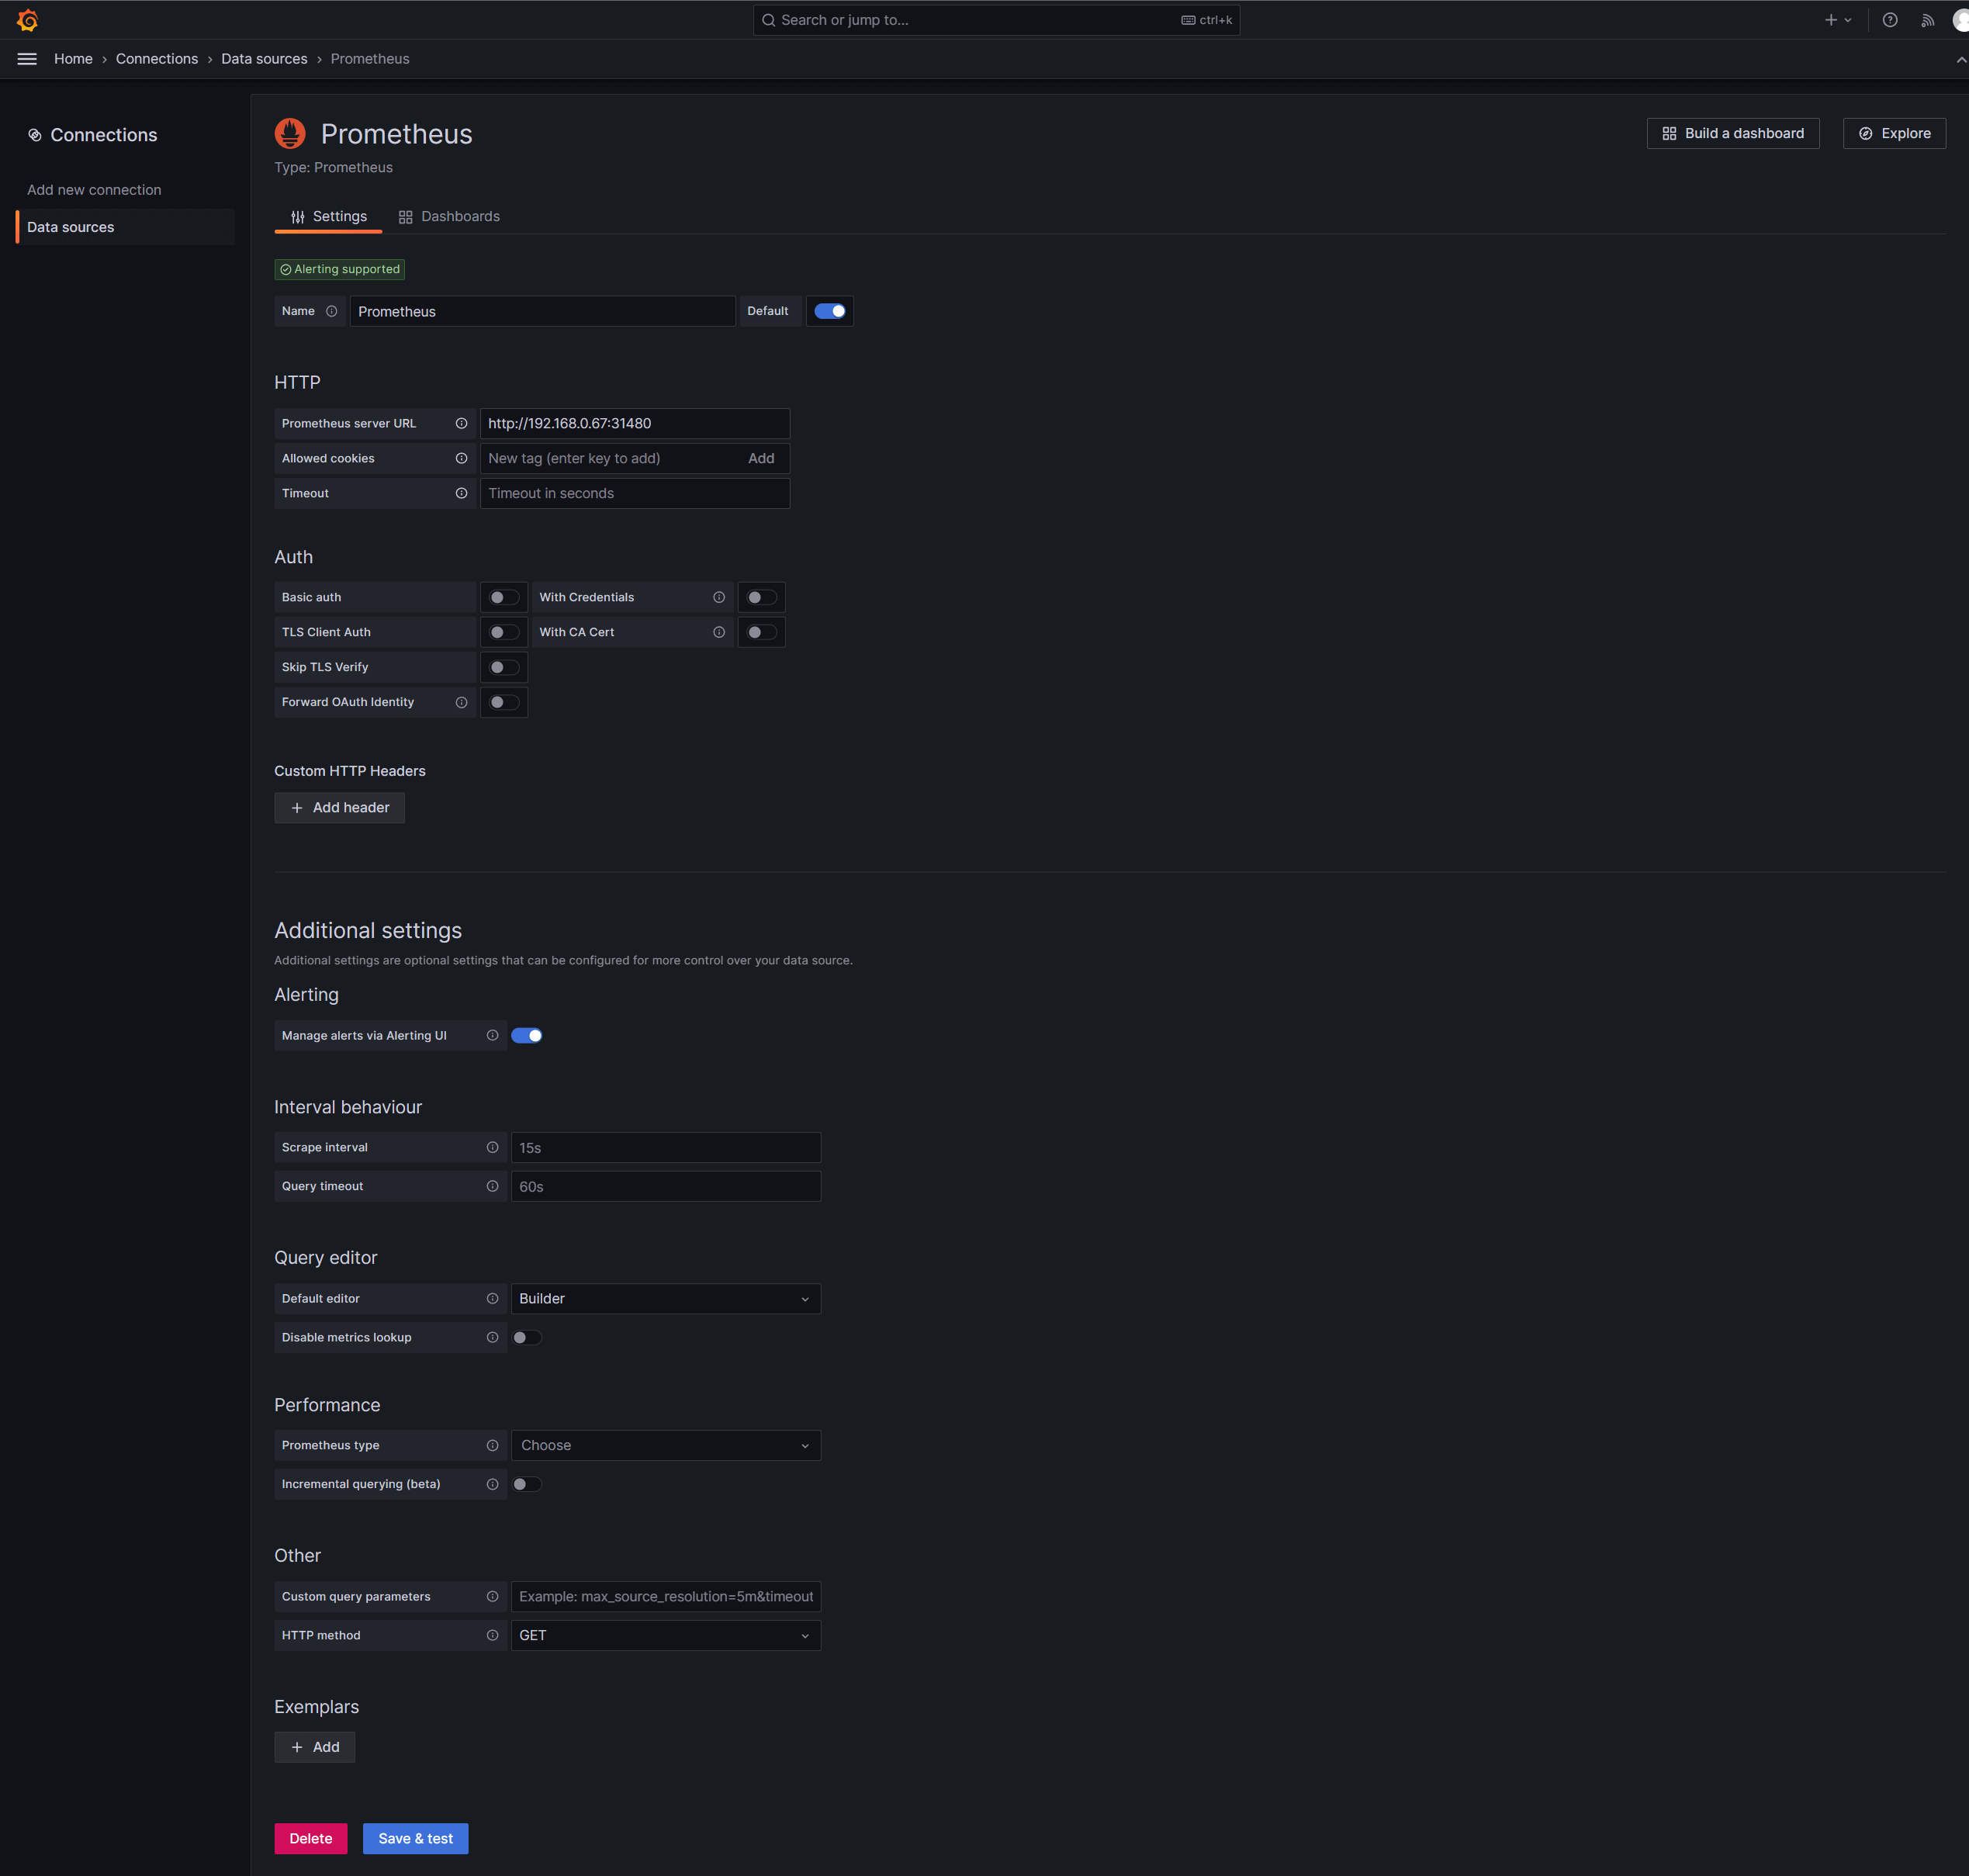
接下来访问 任意节点ip:31481/connections/datasources,将Prometheus引入grafana中,并按照如下配置:
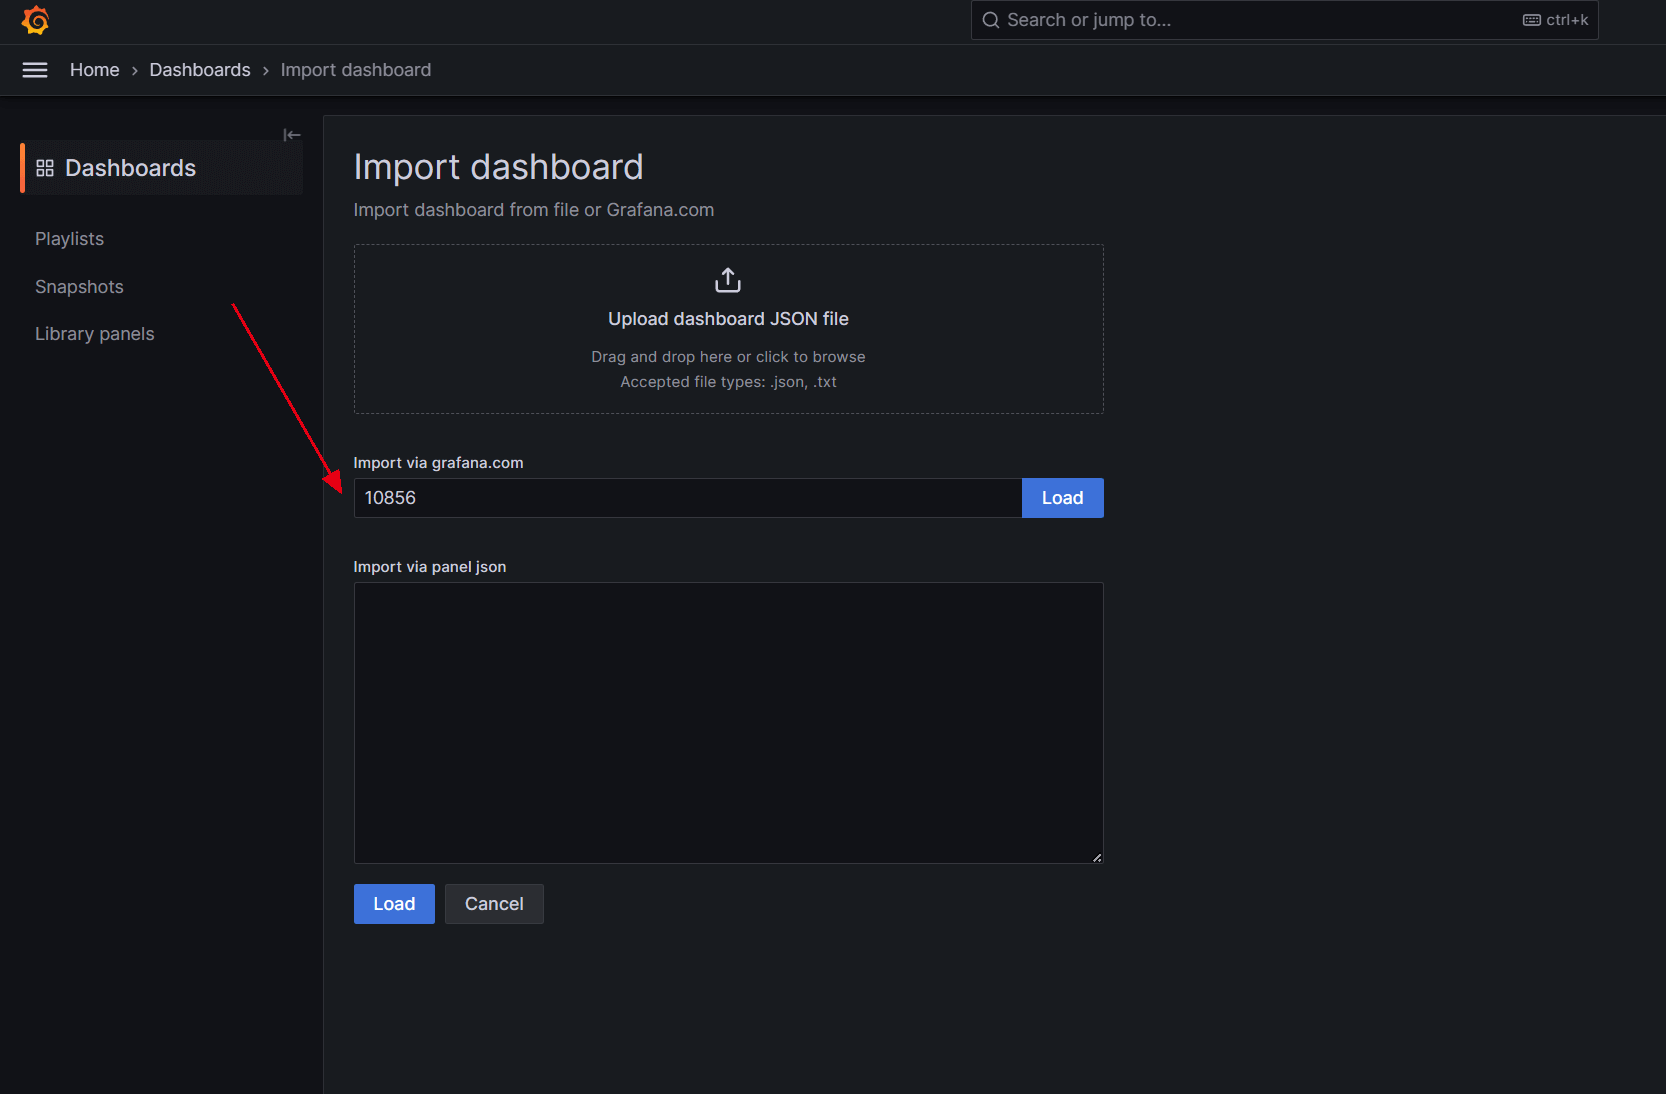
然后我们访问 任意节点ip:31481/dashboard/import,输入面板id 10856,导入面板:
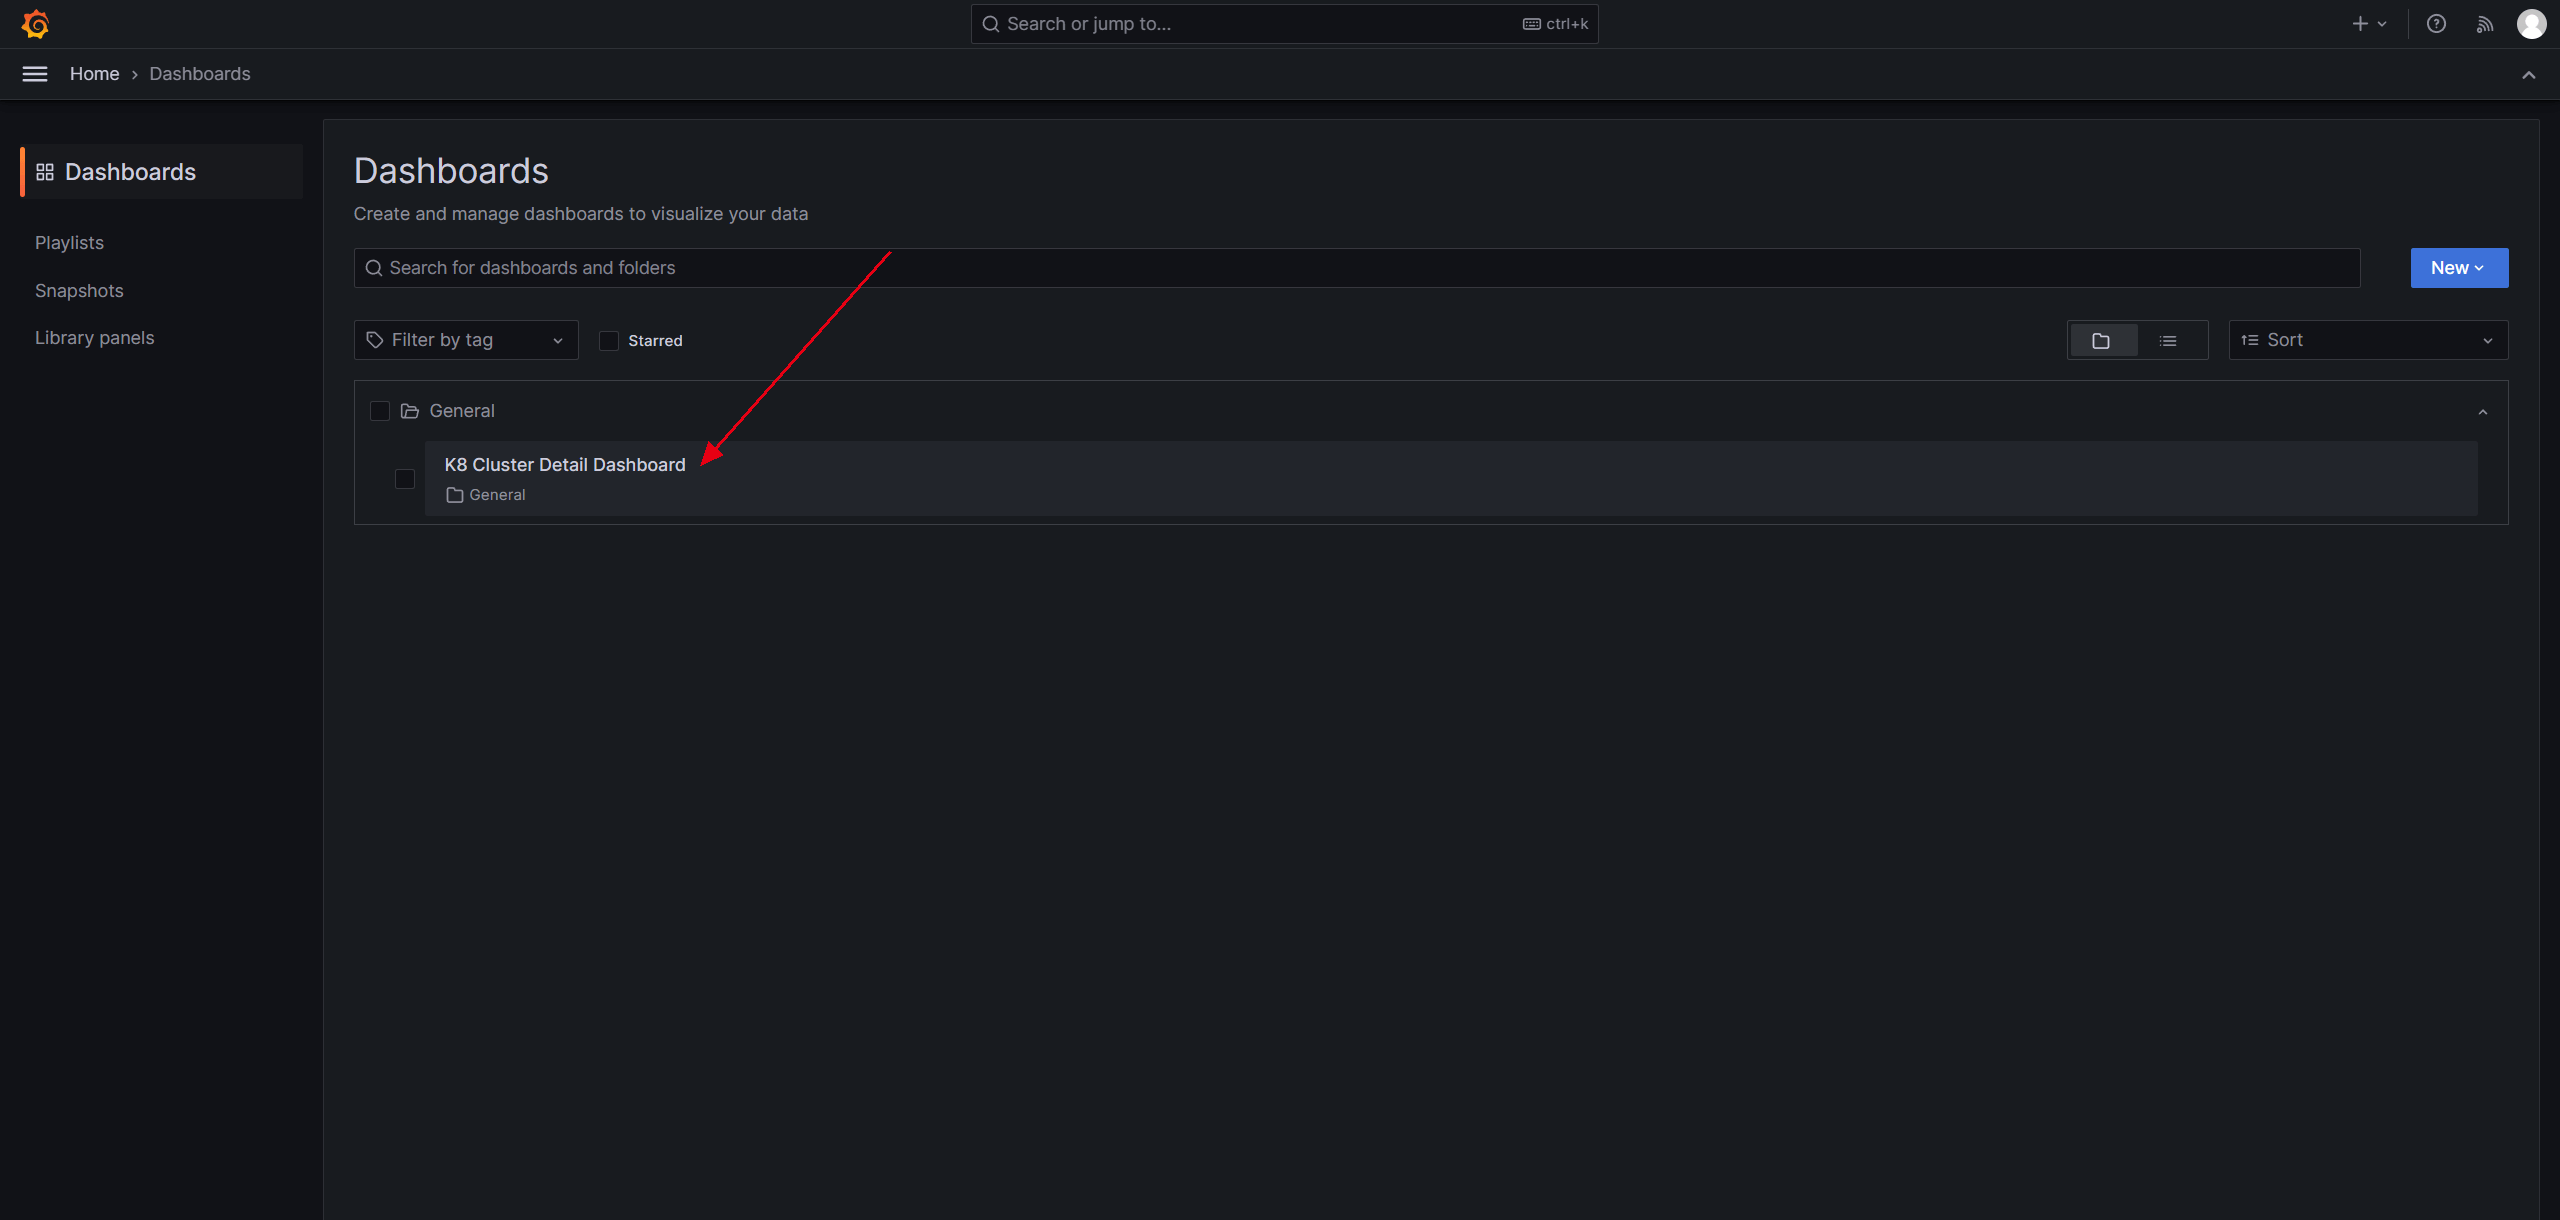
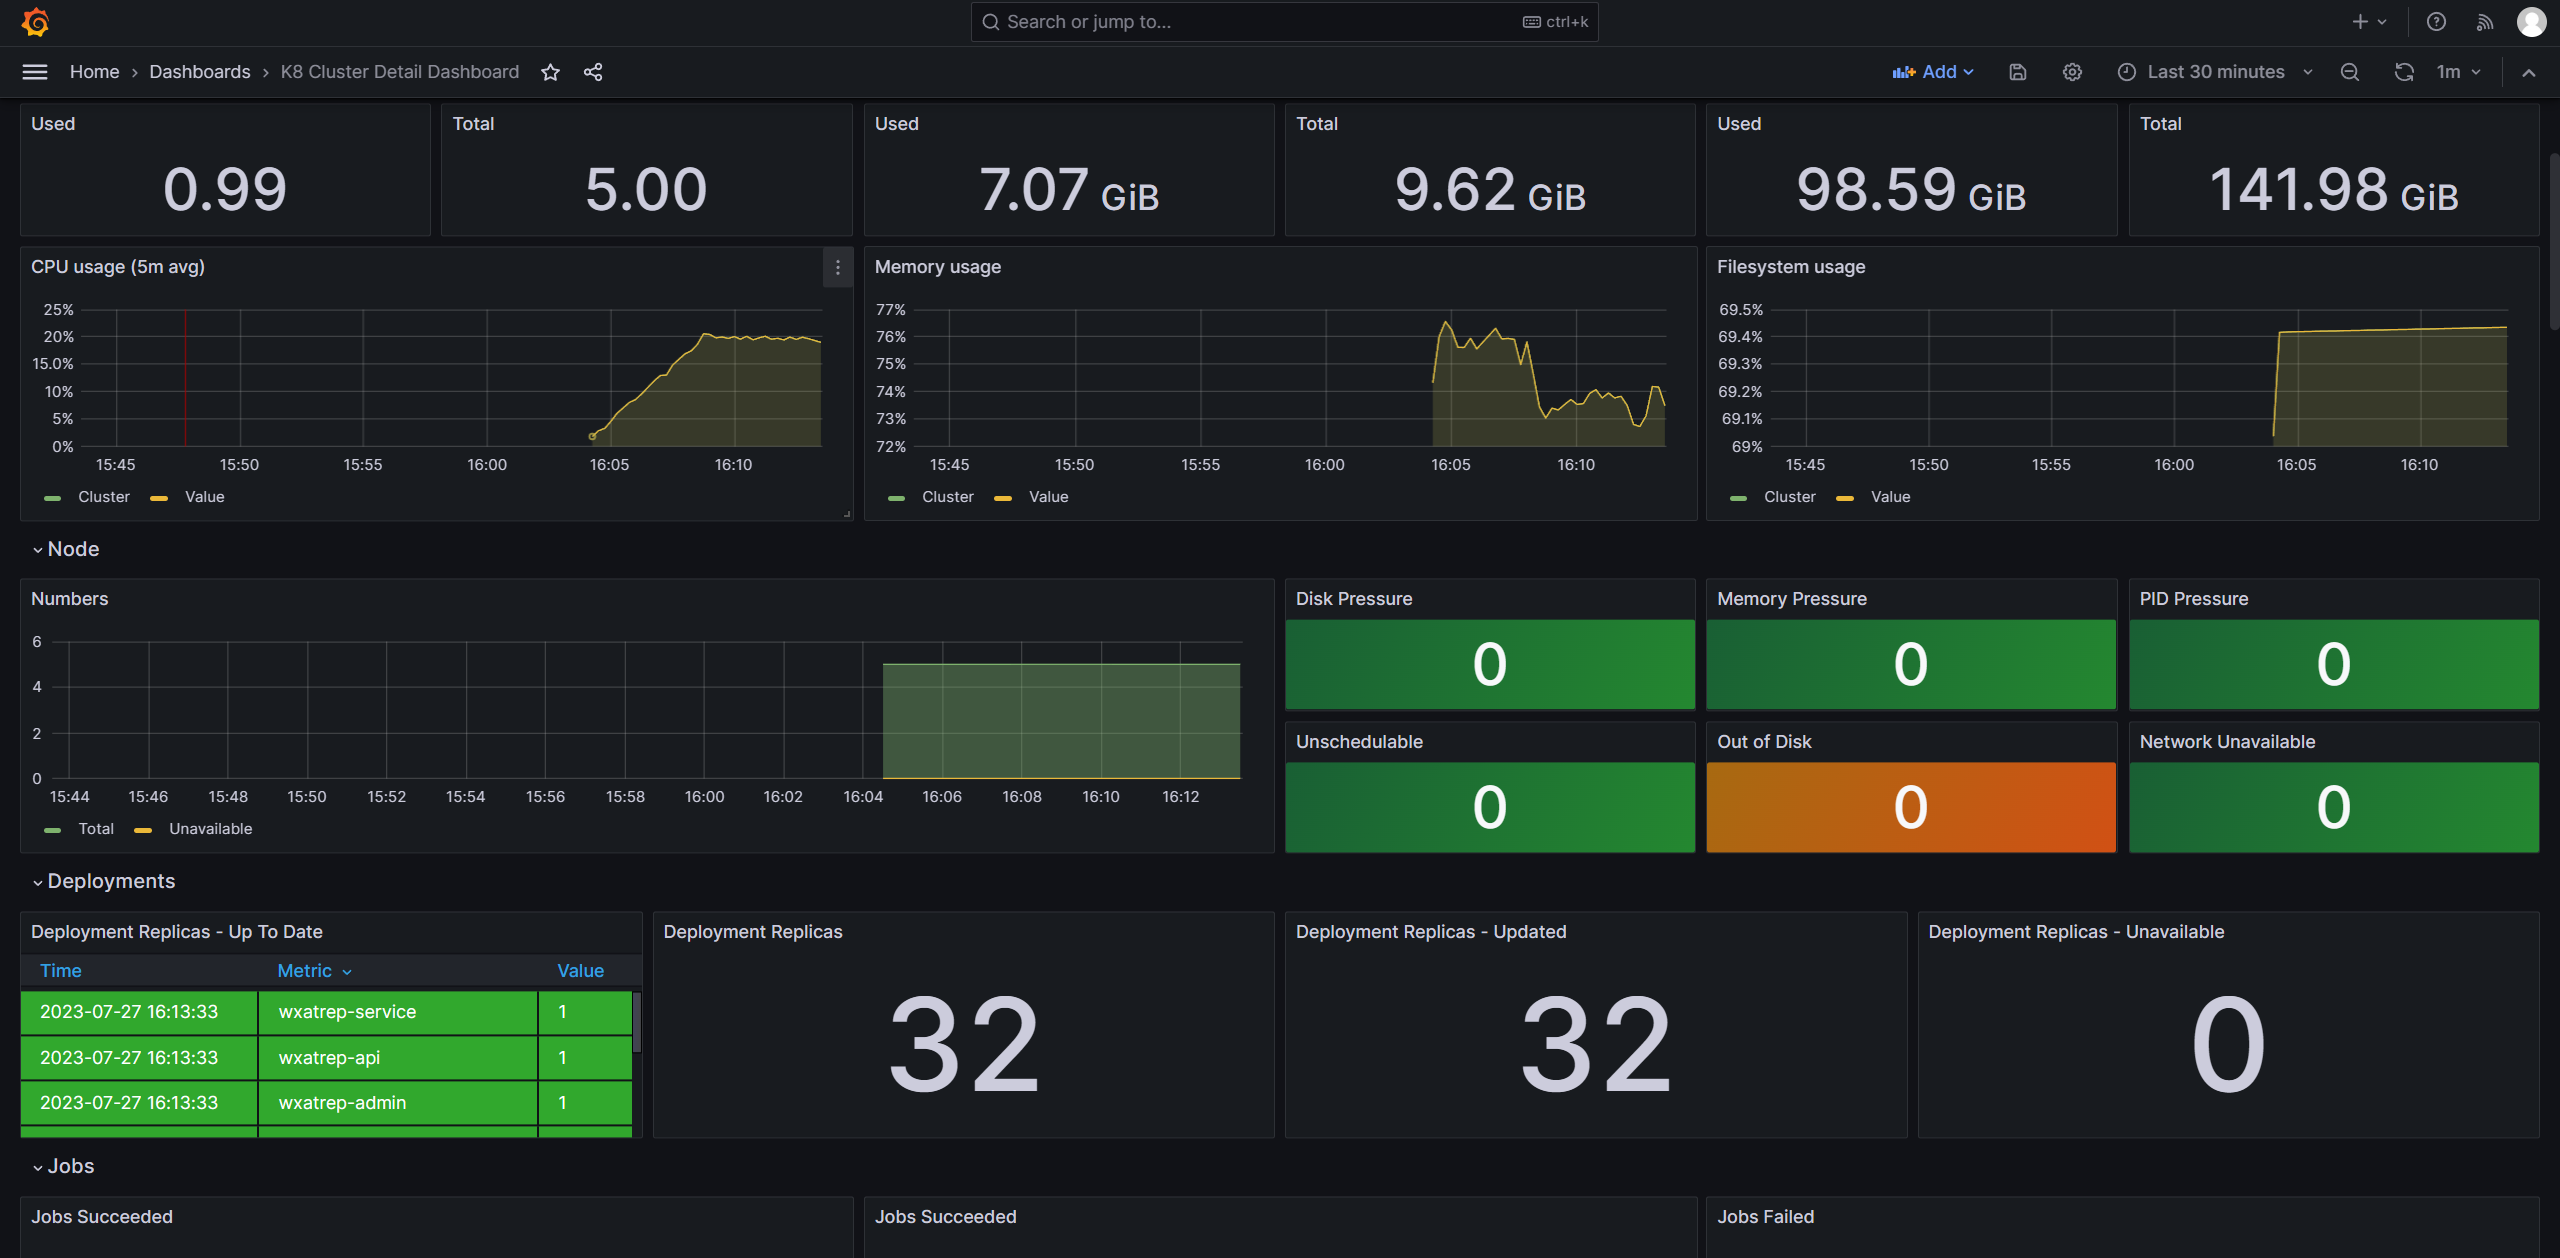
最后访问此面板即可,效果如下:
方法二:Helm商店安装 helm商店安装后占用内存较多,请根据自身机器斟酌
首先添加Prometheus的仓库地址
1 helm repo add prometheus-community https://prometheus-community.github.io/helm-charts
拉取离线包
1 helm pull prometheus-community/kube-prometheus-stack --version 45.1.0
解压离线包
1 tar xvf kube-prometheus-stack-*
修改镜像地址为国内源
1
2
3
4
5
6
7
8
9
10
11
12
13
14
15
16
17
18
cd kube-prometheus-stack/sed -i "s#registry.k8s.io/kube-state-metrics/kube-state-metrics#registry.cn-hangzhou.aliyuncs.com/chenby/kube-state-metrics#g" charts/kube-state-metrics/values.yaml nano value.yaml image: registry: registry.cn-hangzhou.aliyuncs.com repository: chenby/kube-webhook-certgen
安装
1
2
kubectl create ns monitor helm install op . -n monitor
修改 op-grafana 的类型为 NodePort
1
2
3
kubectl edit svc op-grafana -n monitor type : NodePort
修改 op-kube-prometheus-stack-prometheus 的类型为 NodePort
1
2
3
kubectl edit svc op-kube-prometheus-stack-prometheus -n monitor type : NodePort
查看安装结果
1
2
3
kubectl --namespace monitor get pods -l "release=op" kubectl --namespace monitor get svc | grep op kubectl --namespace monitor get pod | grep op
访问 任意节点ip:NodePort即可
Grafana 的默认用户名为 admin,密码为prom-operator
1
2
3
4
5
6
7
8
9
10
11
12
13
14
15
root@m1:/yaml/kube-prometheus-stack alertmanager-operated ClusterIP None <none> 9093/TCP,9094/TCP,9094/UDP 103m op-grafana NodePort 10.43.40.251 <none> 80:31844/TCP 121m op-kube-prometheus-stack-alertmanager ClusterIP 10.43.152.63 <none> 9093/TCP 121m op-kube-prometheus-stack-operator ClusterIP 10.43.206.216 <none> 443/TCP 121m op-kube-prometheus-stack-prometheus NodePort 10.43.113.100 <none> 9090:32088/TCP 121m op-kube-state-metrics ClusterIP 10.43.99.132 <none> 8080/TCP 121m op-prometheus-node-exporter ClusterIP 10.43.235.11 <none> 9100/TCP 121m prometheus-operated ClusterIP None <none> 9090/TCP 103m http://192.168.0.67:31844 http://192.168.0.67:32088
方法三:二进制部署 前置工作
1
2
3
mkdir -p /root/zip/prometheussystemctl stop ufw systemctl disable ufw
将下载的文件放入 /root/zip/prometheus
Prometheus root用户在需要部署Prometheus的节点执行
解压文件
1
2
3
4
tar zxvf /root/zip/prometheus/prometheus-2.45.0.linux-amd64.tar.gz -C /usr/local mv /usr/local/prometheus-2.45.0.linux-amd64 /usr/local/prometheus cd !$ cp prometheus.yml prometheus.yml.bak
修改配置项 nano /usr/local/prometheus/prometheus.yml
1 2 3 4 5 6 7 8 9 10 11 12 13 14 15 16 17 18 19 20 21 22 23 24 25 26 27 28 29 global: scrape_interval: 15s evaluation_interval: 15s alerting: alertmanagers: - static_configs: - targets: rule_files: scrape_configs: - job_name: "prometheus" static_configs: - targets: ["192.168.0.102:9090" ] - job_name: "node_exporter" static_configs: - targets: ["192.168.0.67:9100" ,"192.168.0.102:9100" ,"172.25.4.244:9100" ,"10.0.8.12:9100" ,"10.0.8.7:9100" ]
校验配置文件是否正确
1 /usr/local/prometheus/promtool check config /usr/local/prometheus/prometheus.yml
配置启动服务 nano /usr/lib/systemd/system/prometheus.service
1
2
3
4
5
6
7
8
9
10
11
[Unit] Description=The Prometheus Server After=network.target [Service] Restart=on-failure RestartSec=15s ExecStart=/usr/local/prometheus/prometheus --storage.tsdb.retention.time=3d --config.file=/usr/local/prometheus/prometheus.yml --log.level "info" [Install] WantedBy=multi-user.target
启动服务,开机自启
1
2
3
4
5
6
systemctl daemon-reload systemctl start prometheus systemctl enable prometheus # 实时查看日志 journalctl -u prometheus -f
Node_Exporter
解压文件
1
2
3
4
cd /root/zip/prometheus tar zxvf node_exporter-1.6.1.linux-amd64.tar.gz -C /usr/local mv /usr/local/node_exporter-1.6.1.linux-amd64/ /usr/local/node_exporter cd !$
配置启动服务 nano /usr/lib/systemd/system/node_exporter.service
1
2
3
4
5
6
7
8
9
10
11
12
[Unit] Description=The node_exporter Server After=network.target [Service] ExecStart=/usr/local/node_exporter/node_exporter Restart=on-failure RestartSec=15s SyslogIdentifier=node_exporter [Install] WantedBy=multi-user.target
启动服务,开机自启
1
2
3
4
5
6
systemctl daemon-reload systemctl start node_exporter systemctl enable node_exporter # 实时查看日志 journalctl -u node_exporter -f
Alert_Manager root用户在需要部署Alert_Manager的节点执行
解压文件
1
2
tar -zxvf alertmanager-0.24.0.linux-386.tar.gz -C /usr/local mv /usr/local/alertmanager-0.24.0.linux-386 /usr/local/alertmanager
配置启动服务 nano /usr/lib/systemd/system/node_exporter.service
1
2
3
4
5
6
7
8
9
10
11
12
[Unit] Description=The node_exporter Server After=network.target [Service] ExecStart=/usr/local/node_exporter/node_exporter Restart=on-failure RestartSec=15s SyslogIdentifier=node_exporter [Install] WantedBy=multi-user.target
启动服务,开机自启
1
2
3
4
5
6
systemctl daemon-reload systemctl start node_exporter systemctl enable node_exporter # 实时查看日志 journalctl -u node_exporter -f
Grafana
解压文件,创建用户,配置用户组
1
2
3
4
5
useradd -s /sbin/nologin -M grafana tar zxvf grafana-enterprise-10.0.3.linux-amd64.tar.gz -C /usr/local mv /usr/local/grafana-10.0.3 /usr/local/grafana mkdir /usr/local/grafana/data chown -R grafana:grafana /usr/local/grafana
修改配置 nano /usr/local/grafana/conf/defaults.ini
1
2
3
4
5
6
[paths] data = /usr/local/grafana/datatemp_data_lifetime = 24 hlogs = /usr/local/grafana/logplugins = /usr/local/grafana/pluginsprovisioning = /usr/local/grafana/conf/provisioning
配置启动服务 nano /usr/lib/systemd/system/grafana.service
1
2
3
4
5
6
7
8
9
10
11
12
13
14
[Unit] Description=Grafana After=network.target [Service] User=grafana Group=grafana Type=notify ExecStart=/usr/local/grafana/bin/grafana-server -homepath /usr/local/grafana Restart=on-failure RestartSec=15s [Install] WantedBy=multi-user.target
启动服务,开机自启
1
2
3
4
5
6
systemctl daemon-reload systemctl start grafana systemctl enable grafana # 实时查看日志 journalctl -u grafana -f
参考文章 [1] Helm 安装 Kubernetes 监控套件 - 墨天轮 (modb.pro)
[2] k3s历险记(二):监控系统 - 知乎 (zhihu.com)
[3] 使用kube-state-metrics监控kubernetes并告警_水中加点糖的博客-CSDN博客


 微信
微信