
前言
这一部分我们将改造SpringBoot,让它接入k3s的特性
优雅关机
概念
Kubernetes 中,Pod 的停止分为两种情况:
Graceful Termination:这种情况下,Kubernetes 会尽量通知 Pod 中的应用程序,让它们在关闭前优雅地完成正在进行的任务。具体来说,Kubernetes 会发送一个 TERM 信号给容器里的进程,然后等待一段时间(由 terminationGracePeriodSeconds 参数指定,默认值为 30 秒)以便让进程完成清理工作
Forceful Termination:如果在上述时间到期后,容器中的进程仍未退出,则 Kubernetes 会直接发送 KILL 信号给它们,强制终止容器
spring-boot-starter-actuator 是一个 Spring Boot 的扩展模块,它可以让你方便地监控和管理应用程序。该模块提供了一些 RESTful 接口和 JMX Beans,可以帮助你更好地了解和管理应用程序的运行状况。
以下是 spring-boot-starter-actuator 的一些常用特性:
- /health:该接口可以用来检查应用程序的健康状态。默认情况下,当所有的 HealthIndicator 都返回 UP 时,应用程序被认为是健康的。
- /info:该接口可以用来获取应用程序的信息。你可以通过设置 application.properties 文件中的信息来自定义输出的内容。
- /metrics:该接口可以用来获取应用程序的指标数据,如 CPU 使用率、内存使用情况等。
- /trace:该接口可以用来获取应用程序的请求跟踪日志。它可以帮助你定位应用程序中的问题。
- /auditevents:该接口可以用来获取应用程序的审计事件。
- /env:该接口可以用来获取应用程序的环境变量。
- /loggers:该接口可以用来获取应用程序的日志配置,并修改日志级别。
- /jolokia:该接口可以用来访问 JMX MBeans。
使用 spring-boot-starter-actuator,可以方便地通过 RESTful 接口和 JMX Beans 来监控和管理应用程序,这对于实时追踪应用程序的运行状况、快速排查问题都非常有帮助。
Spring Boot HealthIndicator 可以用于检查应用程序的健康状况,并将该信息公开,以便其他服务和负载均衡器可以使用。
在默认情况下,Spring Boot提供了以下HealthIndicator实现:
- DiskSpaceHealthIndicator:检查磁盘空间是否足够。
- DataSourceHealthIndicator:检查数据库连接是否正常。
- RedisHealthIndicator:检查Redis连接是否正常。
- MongoHealthIndicator:检查MongoDB连接是否正常。
- ElasticsearchHealthIndicator:检查Elasticsearch连接是否正常。
- RabbitHealthIndicator:检查RabbitMQ连接是否正常。
- CassandraHealthIndicator:检查Cassandra连接是否正常。
- SolrHealthIndicator:检查Solr连接是否正常。
当然,你也可以自定义HealthIndicator实现来检查其他服务或组件的健康状况。
实操
引入依赖
1 | <dependency> |
修改application/yaml
我曾设置了 management.server.host:127.0.0.1 导致健康检查一直失败
1 | spring: |
修改 deployment
SpringBoot可不用配置
1 | apiVersion: v1 |
测试
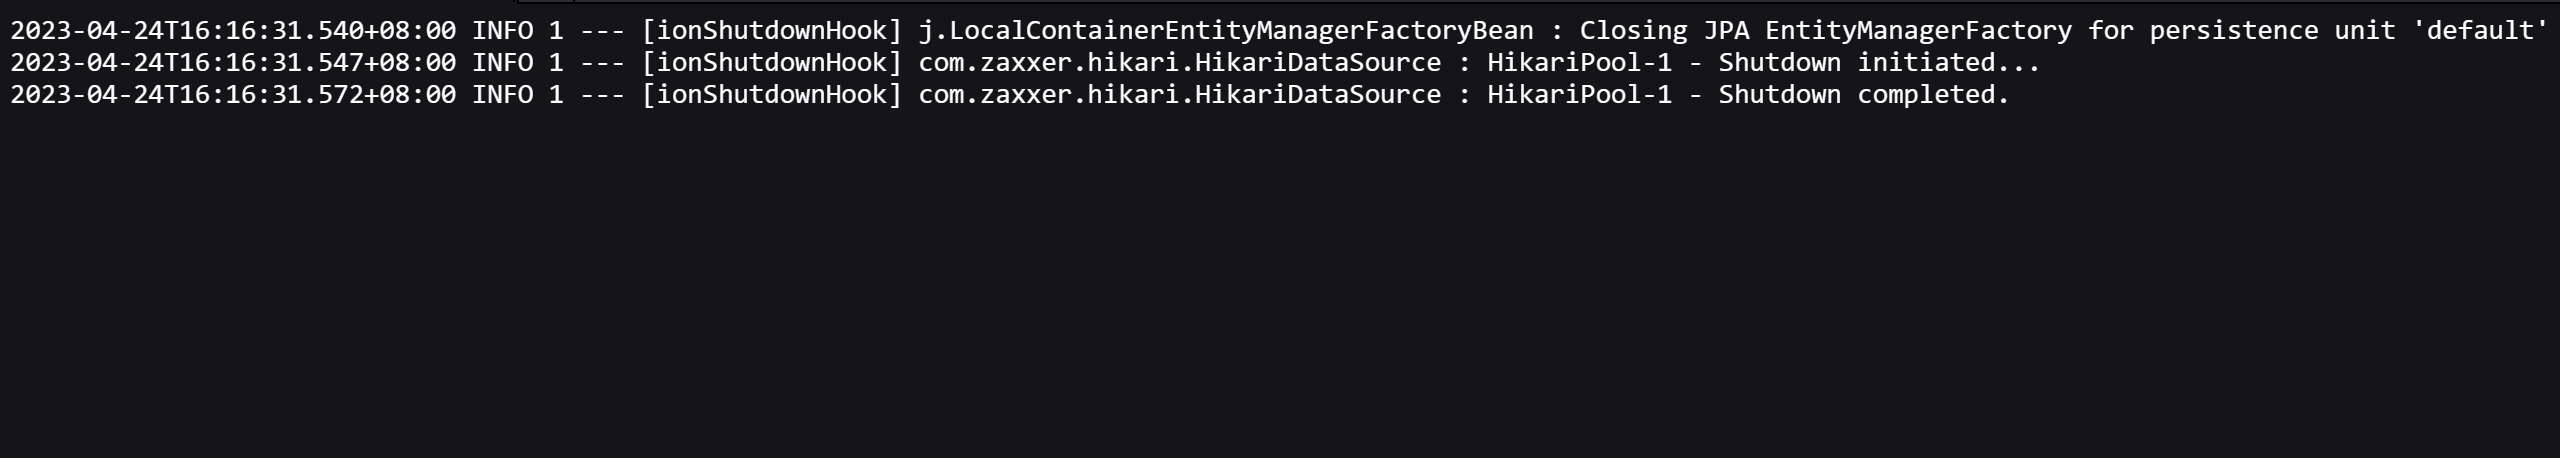
未配置优雅关机
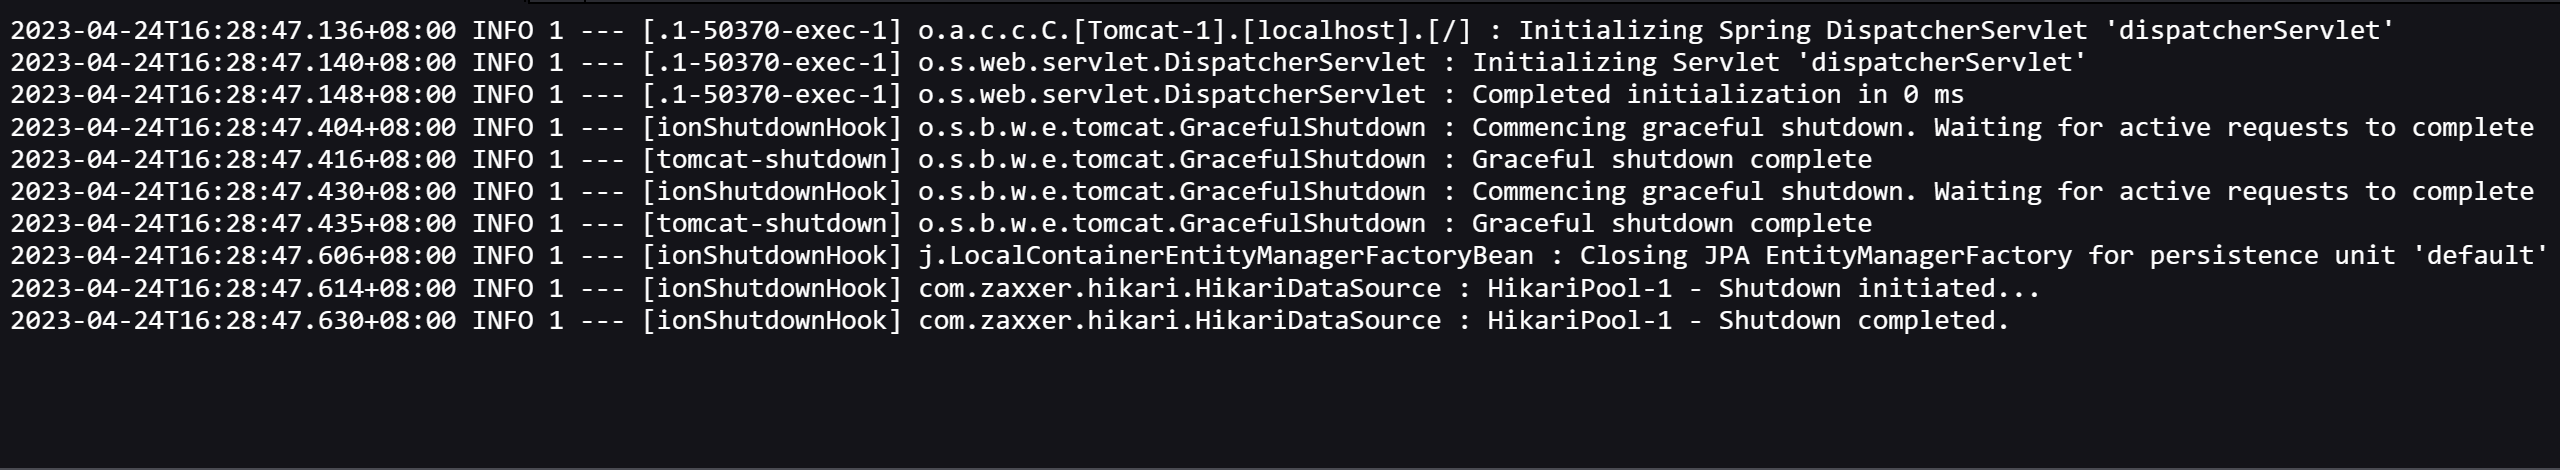
配置了优雅关机
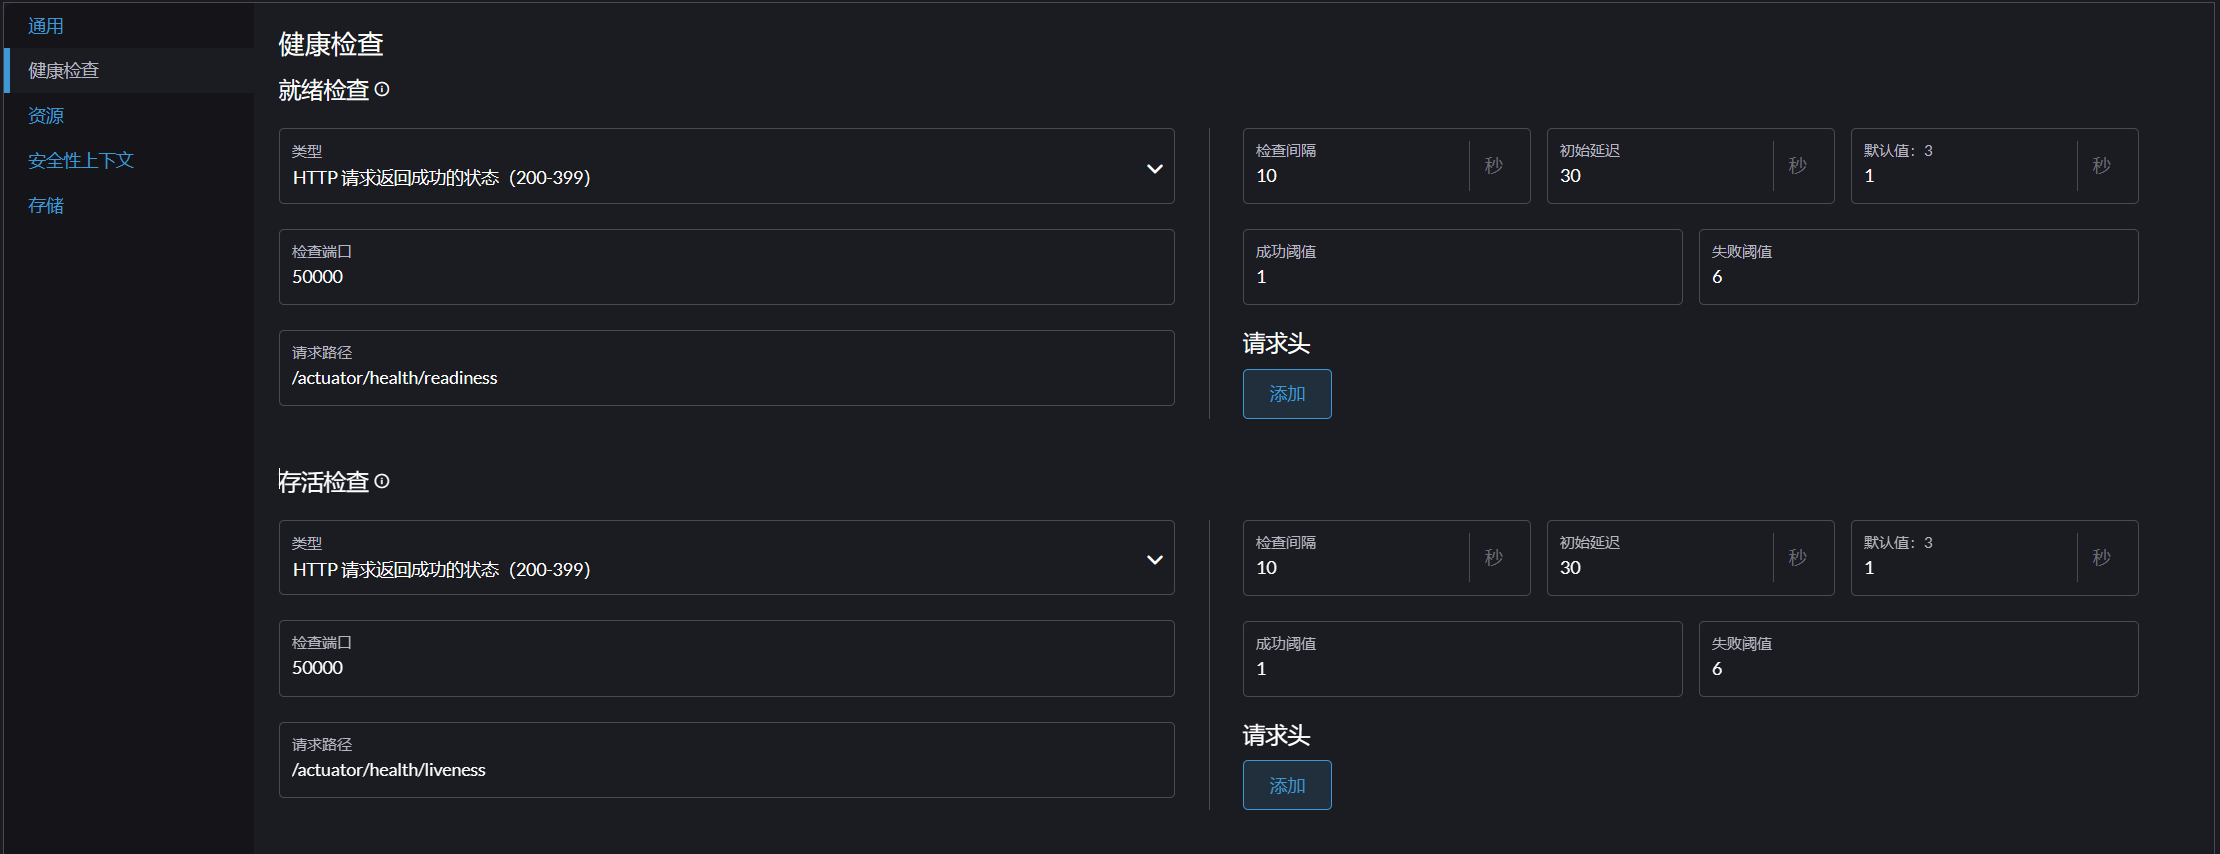
健康检查
1 | apiVersion: apps/v1 |

日志收集
Kubernetes 为容器提供了统一的日志收集机制,可以将容器中的日志输出到一个中心化的地方进行集中管理。Spring Boot 应用程序可以将日志输出到标准输出或标准错误流中,然后由 Kubernetes 自动收集。
这一部分由于内存问题,已经腾不出空间再部署EFK组件了,这里先留一个坑,等我们在本地服务器测试的时候再来补这里的坑~~
参考文章
[1] K8s + SpringBoot实现零宕机发布 - 知乎 (zhihu.com)
[2] 如何在Kubenetes中搭建Springboot项目的日志收集系统_k8s springboot日志_璋L的博客-CSDN博客
 微信
微信- 支付宝